Test Index
SBI PO 5 Jan 2021 Paper
Show Para
Direction (41 - 45) -: Study the given information carefully and answer the questions that follow. The bar graph given below shows the number of electronic items sold by 2 companies A and B across 5 years (2001-2005). 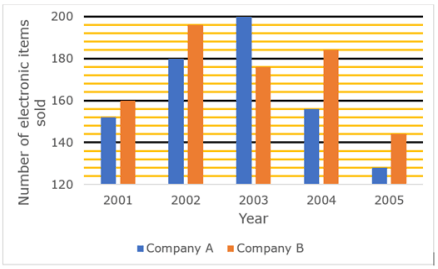
© examsnet.com
Question : 41 of 100
Marks:
+1,
-0
Go to Question: