Test Index
UPSC CDS 2 2021 Math Paper
Show Para
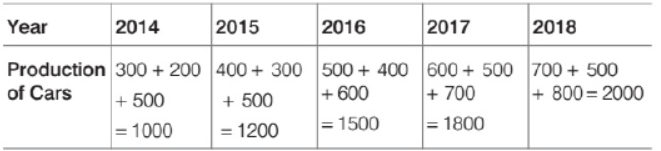
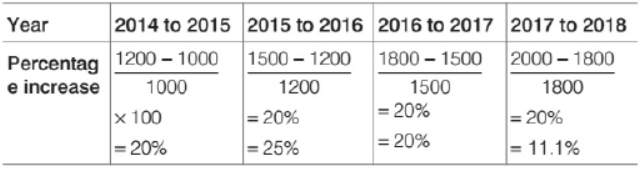
Directions (Q.Nos. 80-83) Consider the following for the next four questions that follow. The following Bar chart gives the production of cars by three different companies X, Y and Z in different years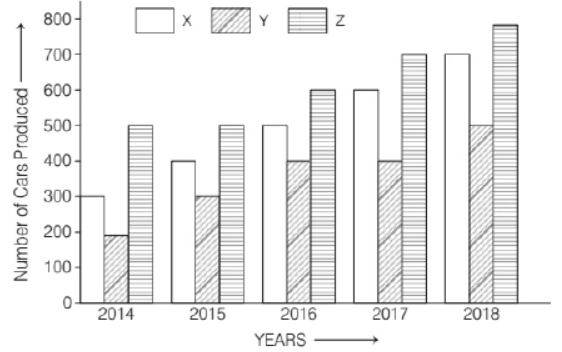
© examsnet.com
Question : 82 of 100
Marks:
+1,
-0
Go to Question: