Test Index
IBPS PO Mains 2018 Paper for online practice
Show Para
DIRECTIONS (Qs. 84-86): Study the graph given below and answer the following questions The graph given below shows the percentage of literates in three different cities in three consecutive years 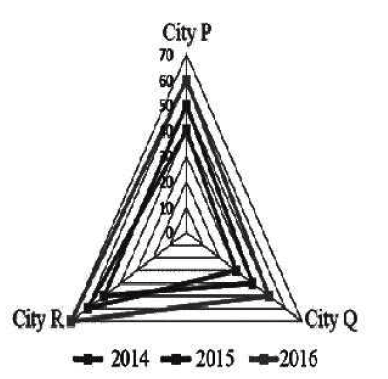
© examsnet.com
Question : 85 of 155
Marks:
+1,
-0
Go to Question: