Test Index
IBPS PO Mains 2019 Paper for online practice
Show Para
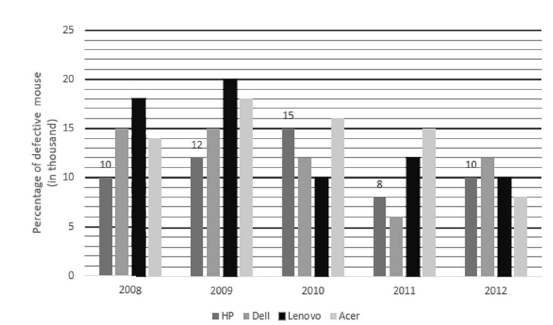
Directions (Qs. No. 31-35): Study the following graphscarefully to answer the following questions. The following table shows the total number of mouseproduced by different companies in 5 different years. The bar graph shows the percentage of defective mouseout of total produced by each company every year. Note: In table some data are missing. Find them firstif they are required in any question and then proceed
| Companies | ||||
| Years | HP | Dell | Lenovo | Acer |
| 2008 | 40,000 | - | 42,000 | 32,000 |
| 2009 | - | 36,000 | - | 36,000 |
| 2010 | - | - | - | 40,000 |
| 2011 | 54,000 | 48,000 | 48,000 | - |
| 2012 | 60,000 | 56,000 | 64,000 | - |
© examsnet.com
Question : 31 of 154
Marks:
+1,
-0
Go to Question: