Test Index
IBPS RRB Office Assistant Mains 7 Oct 2018 Paper
Show Para
Question Numbers: 174-178 Directions: These questions are based on the following graph.The following graph shows the total monthly income and monthly expenditure of eight families – P, Q, R, S, T, U, V, and W.Savings = Total income - (Grocery expenses + Utility bill expenses)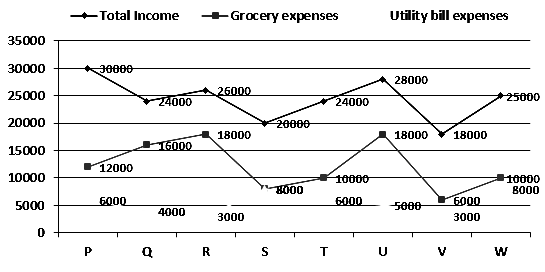
© examsnet.com
Question : 174 of 200
Marks:
+1,
-0
Go to Question: