Test Index
IBPS RRB Officer Scale 1 Exam 12 Sep 2020 Prelims Shift 2 Paper
Show Para
Question Numbers: 46-50 Direction: The given bar graph shows the number of pens sold by two shops A & B in four consecutive months. Study the following data and answer the following questions: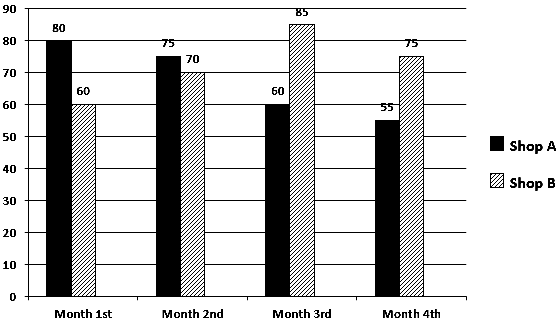
© examsnet.com
Question : 46 of 80
Marks:
+1,
-0
Go to Question: