Test Index
IBPS RRB Officer Scale 1 Model Paper 11
Show Para
Directions (Qs. 41 to 45) : Given below is the graph showing the income of two companies A and B. Study the graph carefully and answer thequestions given below.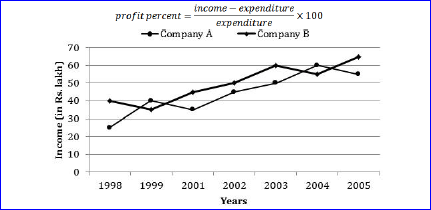
© examsnet.com
Question : 45 of 80
Marks:
+1,
-0
Go to Question: