Test Index
IBPS RRB Officer Scale 1 Model Paper 12
Show Para
Directions (Qs. 61 − 65): Read the given data carefully and answer the given questions. Pie chart shows the percentage distribution of time taken by 8 different persons namely A, B, C, D, E,F, G and H to reach a particular point but the starting point is not same and total time taken by all of themtogether is 500 hr. (partly by car and remaining by train).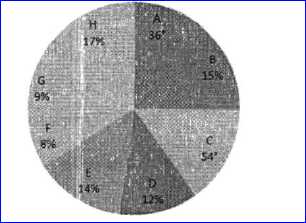 The line graph shows percentage distri bution distance travelled by car out of total distance travelled by them individually.
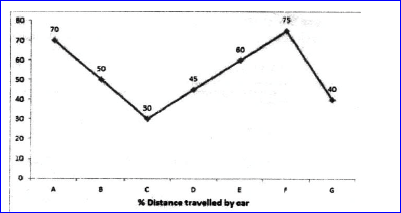
© examsnet.com
Question : 61 of 80
Marks:
+1,
-0
Go to Question: