Test Index
IBPS RRB Officer Scale 1 Model Paper 7
Show Para
Directions (Qs. 46 to 50) : Study the following graph carefully and answer the question given below.The following line graph shows the ratio of wheat production to rice production of a state in India over a period of 7 years from 1999-2006.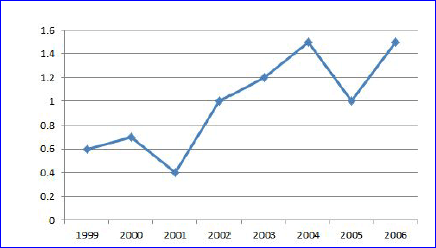
© examsnet.com
Question : 46 of 82
Marks:
+1,
-0
Go to Question: