Test Index
IBPS RRB Officer Scale 1 Model Paper 9
Show Para
Directions (Q. 51 to 55): Given below are the graphs showing the time for which the car of different companies travelled on 2 different days and the corresponding total distance travelled. Study the graphs carefully and answer the following questions: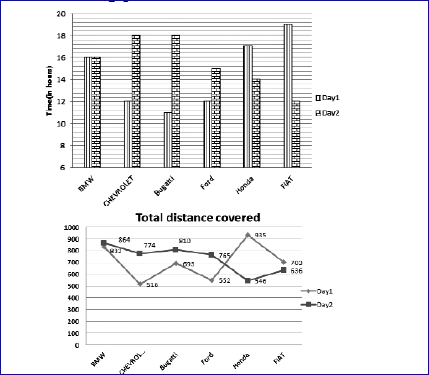
© examsnet.com
Question : 51 of 80
Marks:
+1,
-0
Go to Question: