Test Index
SSC CPO SI and ASI Model Paper 1
Show Para
Directions (Q. 146–150): Read the below bar graph carefully and answer the following questions: The below bar graph shows the import report of rice (in thousand tonnes) during the years 1963, 1964, 1965, 1966, 1967, 1968, 1969 and 1970.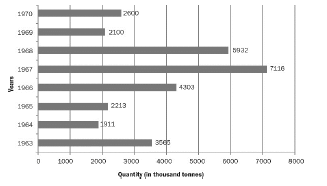
© examsnet.com
Question : 148 of 200
Marks:
+1,
-0
Go to Question: